A 5 mm grid that measures 5 mm
No account · no upload
Paper type19
Notes & writing
Data & plotting
Planning
— mm
PNG at 300 DPI · SVG is vector, transparent · both export one sheet
Generated on your device · no upload, no signup
Settings
More settings
Prints a measured strip. If a ruler disagrees with it, your printer is scaling the page.
Preview · not to screen scale
1:1 detail · 62 × 40 mm
Drawn in real millimeters. Hold a ruler to the screen — if it disagrees, your display's reported DPI is wrong, not the PDF.
Printable ternary paper, to exact spec
A ternary diagram plots mixtures of exactly three components that add up to 100%. Because the three shares aren't independent — fix two and the third is decided — two dimensions are enough, and a triangle is the shape that treats all three equally.
Soil texture classification is the example most people meet first: sand, silt and clay, with the named soil classes marked out as regions of the triangle. The same chart runs through petrology, alloy phase diagrams and formulation chemistry.
Divisions per side scale with the spacing setting, from 4 up to 25. Fewer read more cleanly, more let you place a point precisely. Which side carries which component is your field's convention, so the labels are yours to add.
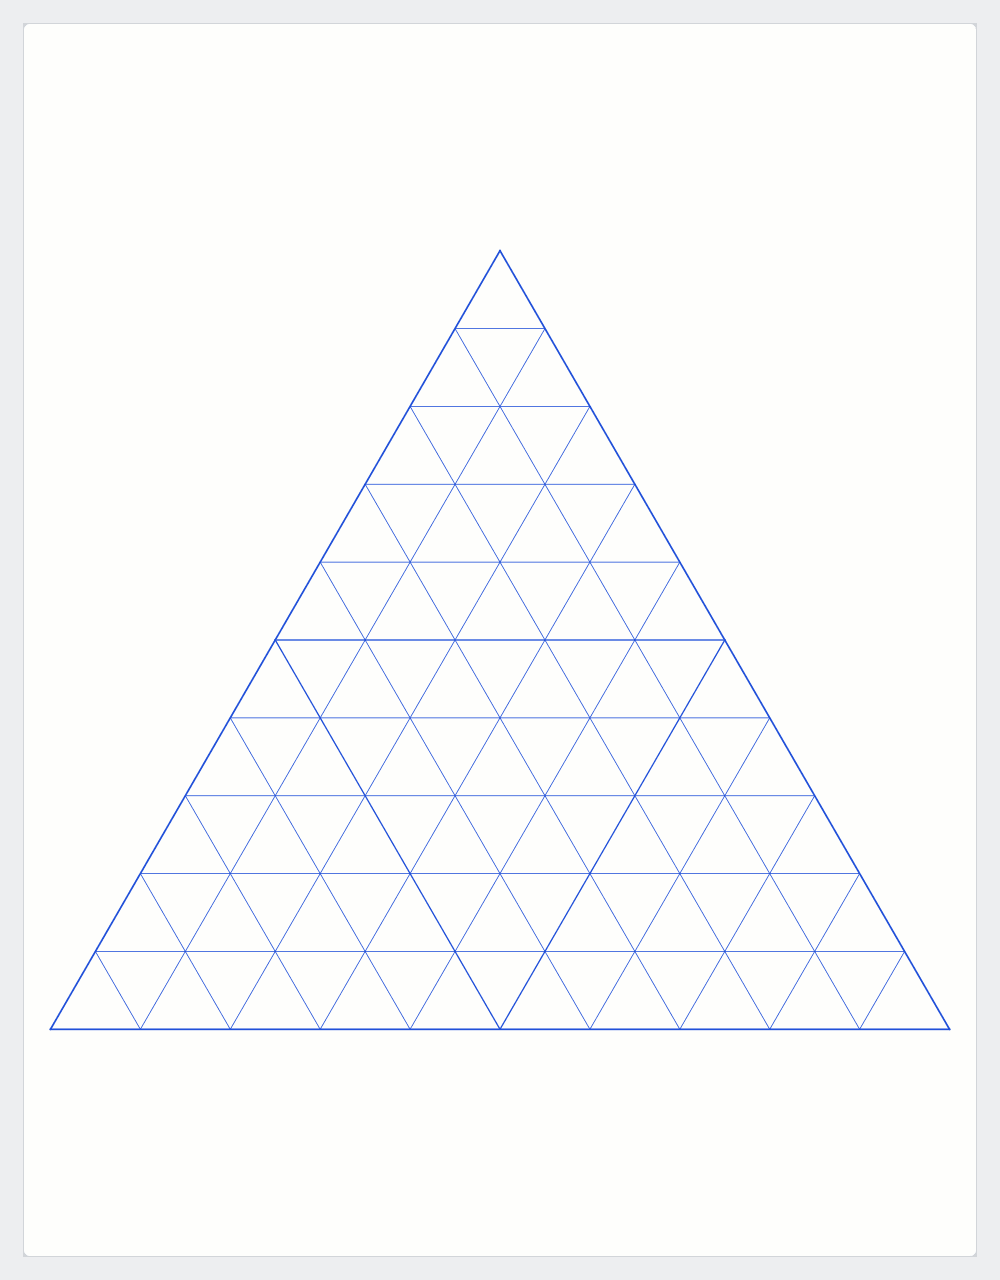
Reading a point
Each component reads 100% at its own vertex and 0% along the opposite side. Lines of constant value run parallel to that opposite side.
Pick a vertex and call it Clay. Draw a line through your point parallel to the far edge, see where it crosses a scale, and read the value. Repeat for the other two. They will total 100.
The scales do not all count the same way around the triangle, and published charts differ on clockwise versus counterclockwise. A component read backwards gives a plausible-looking point in the wrong place, so put a known composition through the chart before trusting it.
Soil texture
The USDA soil texture triangle plots sand, silt and clay by weight, with twelve named classes drawn as regions. Loam sits in the middle, and the class boundaries are drawn lines rather than formulas.
Those fractions describe the fine earth fraction only, meaning particles under 2mm. Gravel and stones are excluded and reported separately, so the texture class says nothing about how stony a soil is.
Divisions and labeling
The setting runs from 4 divisions per side to 25. 10 gives 10% steps, which most published diagrams use. 20 gives 5% steps and is about as fine as stays legible on Letter or A4. Past that the three sets of lines interfere and the small triangles fill in.
Nothing is labeled. Which vertex carries which component, the direction the scales run, and whether ticks read as percentages or fractions all vary between petrology, soil science and metallurgy. Write the components on the vertices yourself and mark the direction.
Frequently asked questions
What's it for?
Three-part compositions that add up to 100% — soil classification, phase diagrams, mixture design.
How do I read a point?
Each side is one component. A point's distance from that side, measured parallel to the opposite side, gives its share. The three always total 100.
Can I label the axes?
By hand. The generator draws the grid only.