A 5 mm grid that measures 5 mm
No account · no upload
Paper type19
Notes & writing
Data & plotting
Planning
— mm
PNG at 300 DPI · SVG is vector, transparent · both export one sheet
Generated on your device · no upload, no signup
Settings
More settings
Prints a measured strip. If a ruler disagrees with it, your printer is scaling the page.
Preview · not to screen scale
1:1 detail · 62 × 40 mm
Drawn in real millimeters. Hold a ruler to the screen — if it disagrees, your display's reported DPI is wrong, not the PDF.
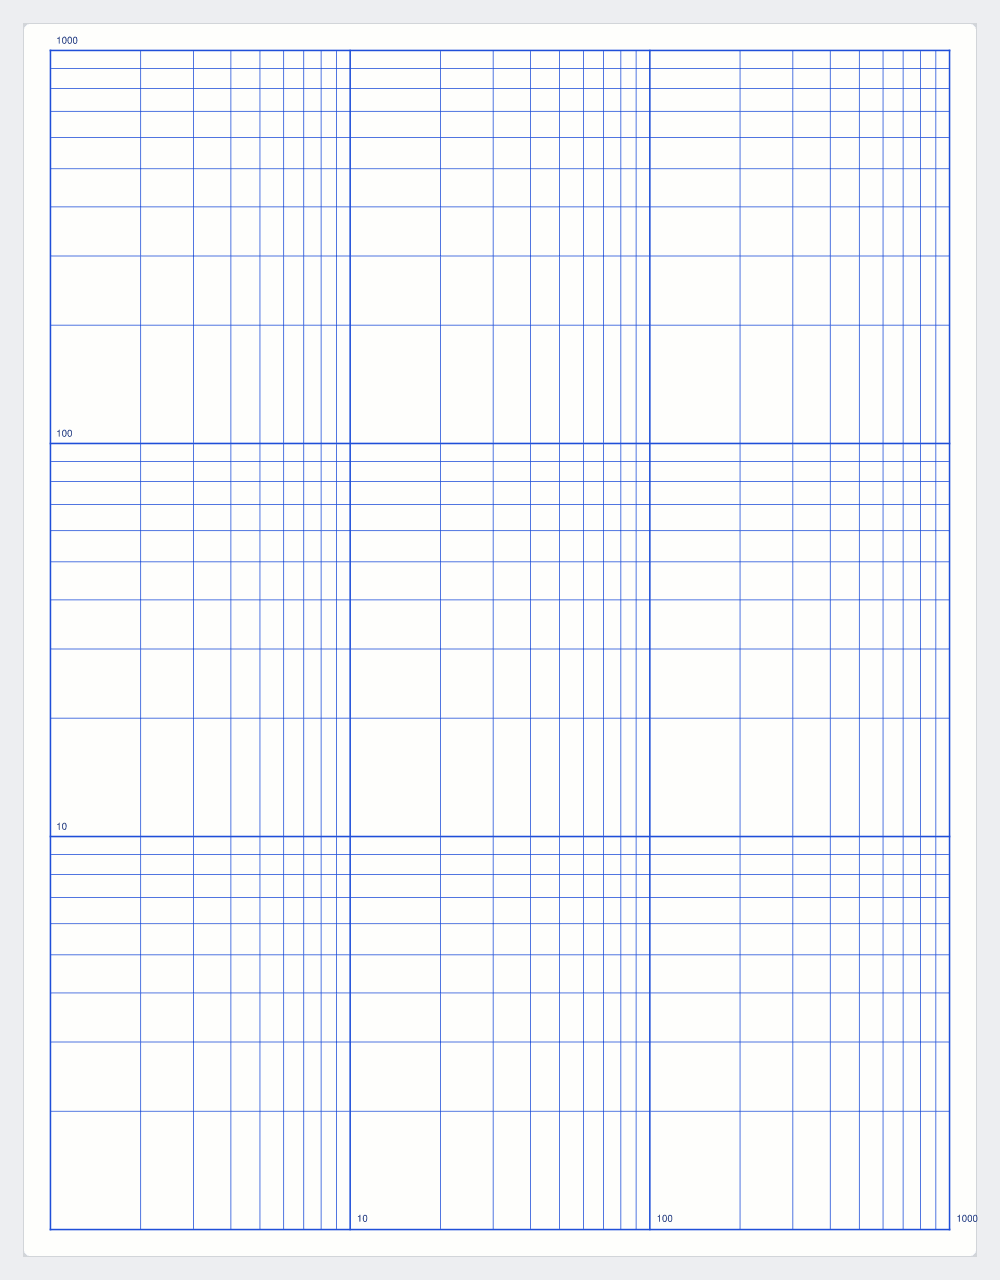
Printable log-log paper, to exact spec
Log-log paper puts both axes on a logarithmic scale, and that does one specific thing: it turns power laws into straight lines. If y = ax^b, the plot is a line of slope b, and measuring that slope off the page is frequently the entire point of the experiment.
Which makes it the grid for allometric scaling, particle size distributions, fracture mechanics, earthquake magnitude-frequency relationships — anywhere both variables move through several orders of magnitude.
Both axes take the same decade count here, so pick the range that needs the most room. The starting decade is adjustable if your data doesn't begin at 1.
Getting the exponent off the page
If y = ax^b, then log y = log a + b times log x, so the plot is a straight line of slope b.
To measure b, pick two points on the line, count decades vertically, count decades horizontally, and divide. Two decades up against one across is slope 2, so y goes as x squared. One up against two across is slope 0.5.
Count decades rather than millimeters. Both axes here share a decade count, so a slope of 1 comes out at 45 degrees.
Bends, and how much range you need
A power law that holds over a range and then stops is common, and the bend marks where something changed: a mechanism ran out, another took over, or the measurement stopped being reliable.
Kleiber's law is the standard example, with metabolic rate scaling as body mass to about the 3/4 power. The Gutenberg-Richter relation does the same for earthquake frequency against magnitude, and its bend at low magnitudes is usually the detection limit of the seismic network.
A straight line over one decade is weak evidence. Scattered points across one decade look straight under most relationships. Two decades is a weak claim, three is worth something.
Interpolating between the lines
Halfway up a decade by eye looks like 5.5. The geometric middle is the square root of 10, about 3.16. A third of the way up is about 2.15, two thirds about 4.64.
Both axes take the same decade count. If you need five decades on one and two on the other, which happens in particle sizing, this page will waste space at one end.
Frequently asked questions
What's it for?
Power laws, allometric scaling, particle size distributions — anything where both variables span orders of magnitude.
Why does a straight line matter?
It means a power law. The slope gives you the exponent, which is usually the thing you're trying to measure.
Can the two axes have different decade counts?
Not yet — both use the same count. Pick the range that needs the most room.