A 5 mm grid that measures 5 mm
No account · no upload
Paper type19
Notes & writing
Data & plotting
Planning
— mm
PNG at 300 DPI · SVG is vector, transparent · both export one sheet
Generated on your device · no upload, no signup
Settings
More settings
Prints a measured strip. If a ruler disagrees with it, your printer is scaling the page.
Preview · not to screen scale
1:1 detail · 62 × 40 mm
Drawn in real millimeters. Hold a ruler to the screen — if it disagrees, your display's reported DPI is wrong, not the PDF.
Printable semi-log paper, to exact spec
On a linear grid, exponential data is a curve that hugs the bottom of the page and then leaves the top of it. You can't read anything off that. Put the same data on a logarithmic Y axis and it straightens into a line whose slope is the growth rate.
That's what semi-log paper is for: bacterial cultures, radioactive decay, drug clearance, compound interest, and Bode plots, where the frequency axis does the same job.
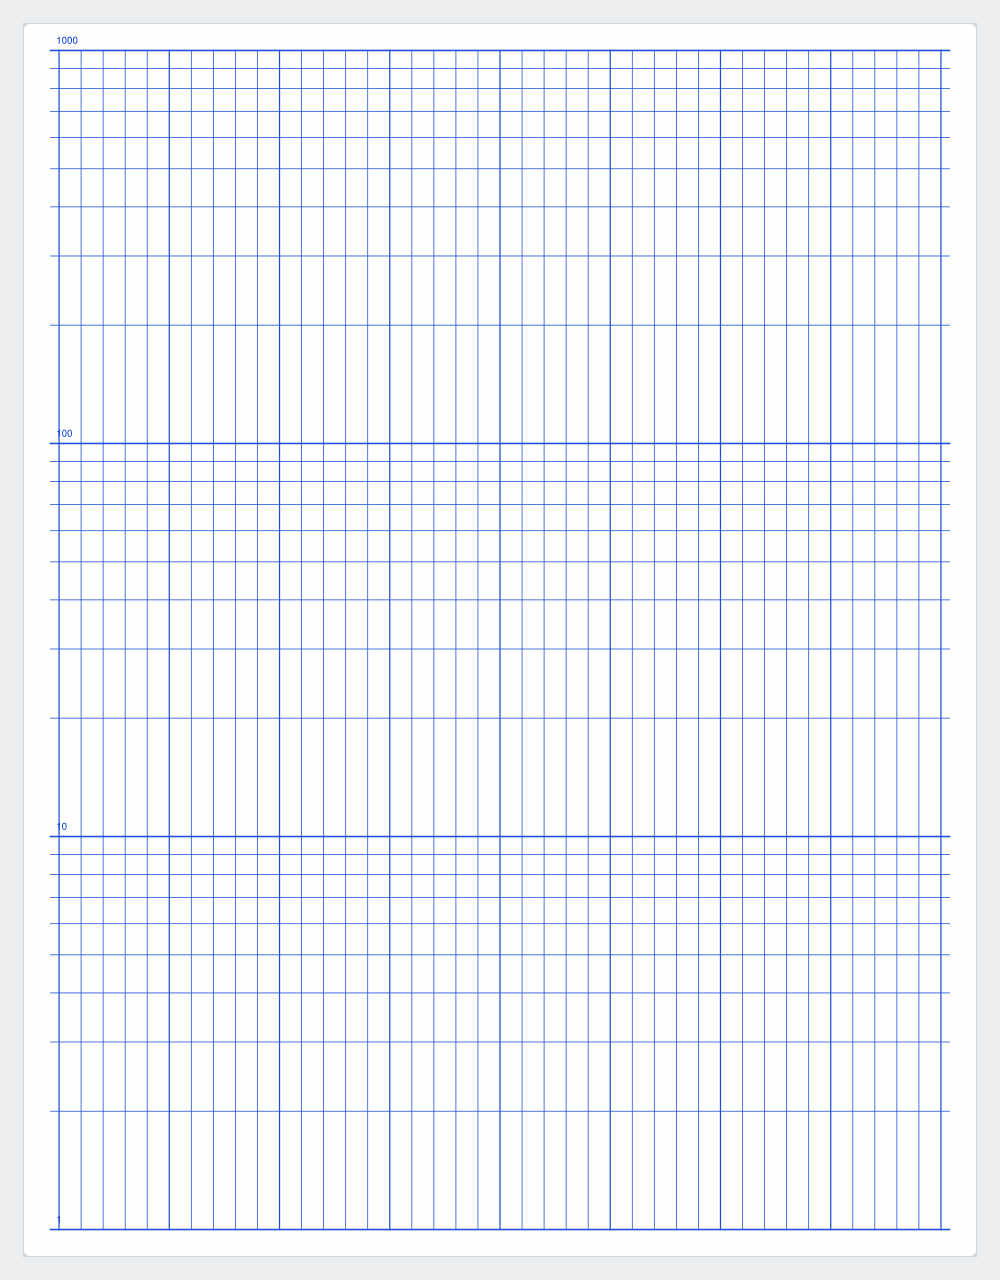
Each decade — each factor of ten — gets an equal band of the page, subdivided by log10 within it. Choose enough decades to cover your range: 1 to 1,000 is three. The axis can start anywhere from 0.001 upward if your data doesn't begin at 1.
Reading the slope
A straight line means exponential behavior, and the slope gives the rate.
If the line climbs one decade across a horizontal span, the quantity multiplies by ten over that span. A decade is about 3.32 doublings, so divide to get doubling time.
On a linear plot, exponential and merely fast-growing data look similar. On semi-log, exponential data is straight. In a bacterial culture the log phase is the straight section, and the point where the line bends is where growth stopped being exponential.
Why the gridlines bunch up
Within each decade the lines mark 2 through 9, and they crowd toward the top.
The distance from 1 to 2 is log10(2), about 0.30 of the decade. From 2 to 3 is about 0.18. From 9 to 10, about 0.046. The first step takes nearly a third of the band and the last takes a twentieth.
Reading precision is not uniform. The low end of each decade can be read more finely than the high end.
Decades and the starting value
Set the decade count from your data's range. Three decades covers 1 to 1,000. Extra decades compress the data you have into a smaller band.
The starting decade handles data that does not begin at 1. Set it to 0.01 and three decades run from 0.01 to 10.
The axis cannot start at zero. The logarithm of zero is undefined, so zero has no position on the scale. If your data contains zeros, plot the nonzero points and report the zeros separately.
Bode plots
This page puts the log scale on Y, which suits growth and decay with time along the bottom.
A Bode magnitude plot needs log frequency on X and linear decibels on Y. The grid is the same, so print it and turn the sheet a quarter turn. Set the page to landscape first if you want the long edge as the frequency axis.
Frequently asked questions
What's it for?
Anything that grows or decays exponentially — bacterial growth, radioactive decay, Bode plots. You get straight lines instead of unreadable curves.
How many decades?
Match your data. 1 to 1,000 is three decades.
Which axis is logarithmic?
Y. X stays linear.
Semi-log or log-log?
Log-log if both variables span orders of magnitude.